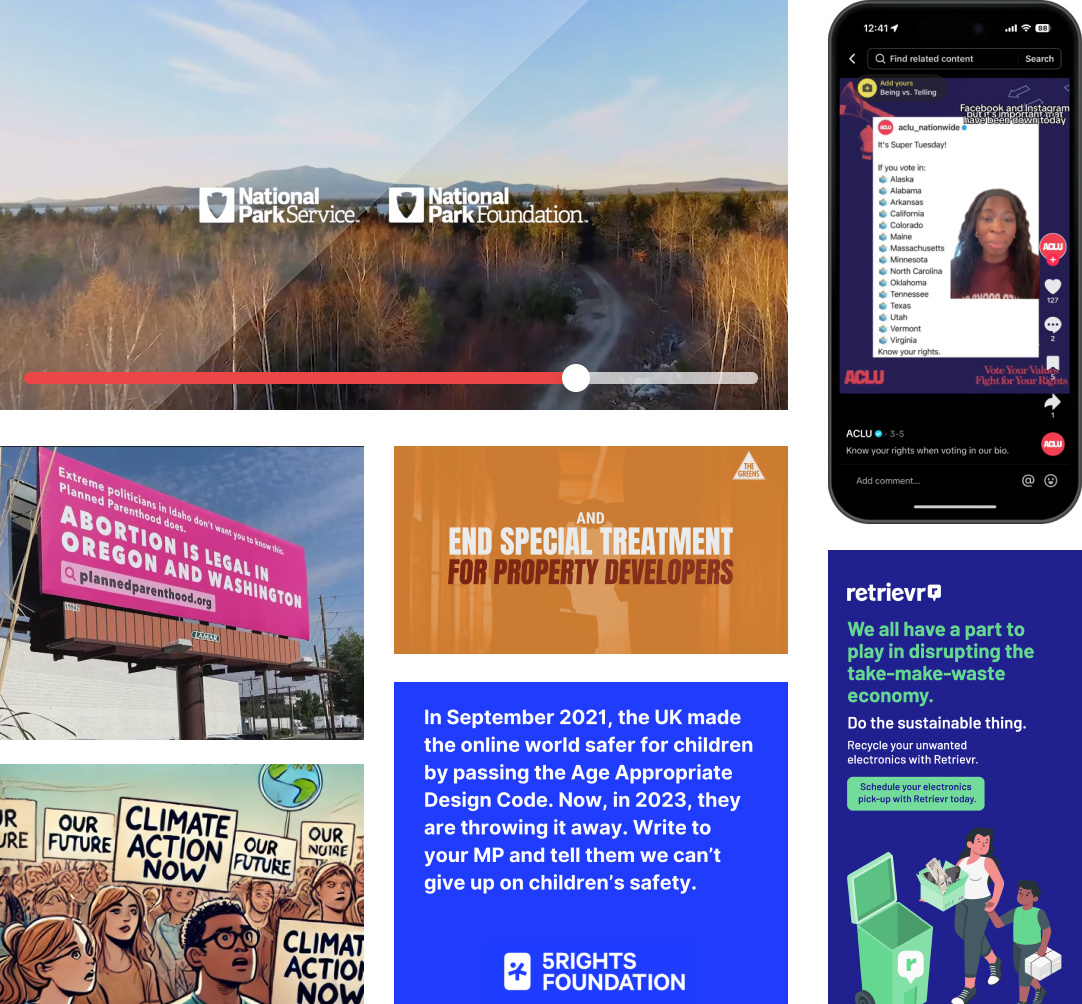
Ad Testing in 24 Hours
Will your ads persuade voters? Swayable's patented technology measures persuasion and mobilization of your ads before spending on media.
Test anything you can see or hear
Any stage of development
Messaging, copy, concept mockups, storyboards, videos, final assets, organic content
Any element
Spokespeople, pricing, packaging, audience segments
Any stage of the funnel
Awareness, favorability, consideration, purchase intent
Test head to heat
Learn if your content neutralizes opposition messages successfully

Open-ends
Learn from what people have to say
Collect highly detailed qualitative data from your audience with open-ended questions. Respondents are able to answer in their own words, providing insights unanticipated and valuable insights.
At Swayable, we also use Open-ended questions to add an additional layer of quality control. We review each response to ensure that respondents paid attention to the survey and provided valuable feedback.
Comprehensive respondent demographics
Summarized key topic
Export responses to slides
Choose custom metrics
Swayable's suite of metrics provides marketers with valuable tools for evaluating campaigns. Measure persuasion, purchase intent, likelihood to vote, and more. Swayable's approach, utilizing comprehensive Average calculations and Occurrence data points, empowers data-driven optimization. Leveraging these analytic capabilities positions marketers for sustained success.
Segment by audience
Drill down into the responses of different segments, each with statistical significance. Swayable segmentation criteria include demographics (age, gender, income), psychographics (lifestyles, values, attitudes), behaviors (voting history, online activity), geographic location, and custom segments built for your specific needs.
Get results in 24 hours
Results live in 24 hours from thousands of respondents, with real-time analysis of impact scores, long-form comments, and emotional reactions via online dashboard.
Increase ROI by 2-10x
Set up your ads for success with scientific measurement of creative impact. Unlock 2-10x increase in ad ROI by integrating data-driven insights across messaging, creative development and media planning.
Swayable called more election races correctly than any other firm.
In a series of public data quality demonstration polls, Swayable called 93 percent of races correctly in the 2020 U.S. Presidential elections: a percentage that only two firms beat, both of whom published fewer polls. Swayable’s U.S. presidential popular vote polls were correct within 1 percentage point: 4 times more accurate than leading pollsters. All results were logged in advance with independent aggregators including 538.
68 polls
Published during the 2020
US elections cycle
93%
Races called correctly
1.0 pts
Polling error from the final
national presidential result
Applying data science to persuasion
PhDs James Slezak and Valerie Coffman co-founded Swayable to apply advanced statistical methods to the question: What changes voters' minds?
We use randomized controlled trials (RCTs), the type of tests used in clinical research, to isolate the impact of creative assets and provide the most robust data available on messaging persuasion.